
Leave Your Message

How to Choose the Right Quartz Cell in 2026?

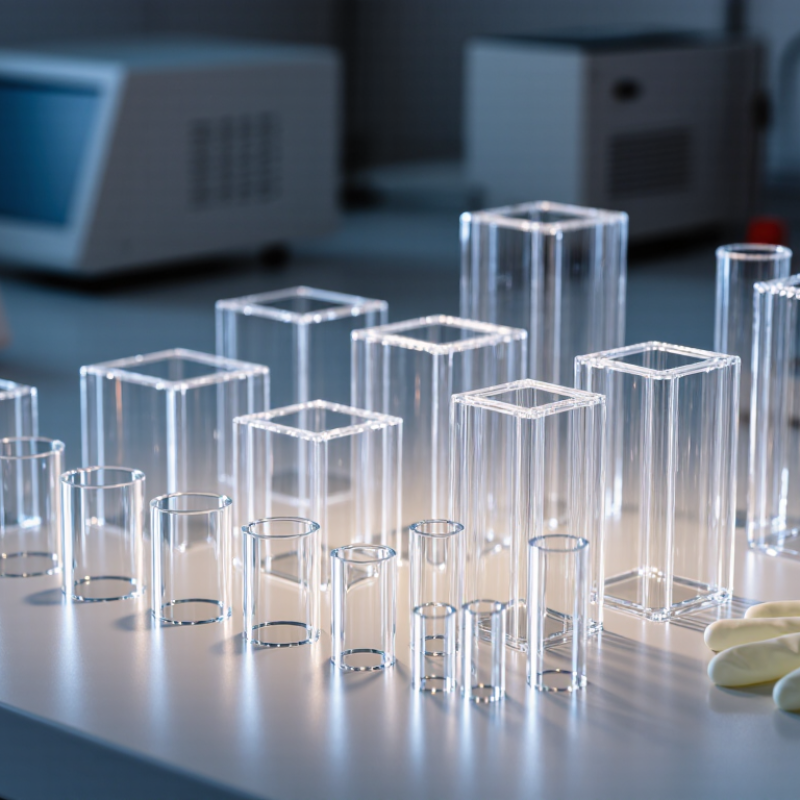
Choosing the right Quartz Cell in 2026 begins with the measurement, not the product catalog. A cell for ultraviolet analysis must transmit deep UV wavelengths reliably. A visible-range experiment may need less demanding optical performance. Fluorescence work introduces another concern: geometry. Four-sided cells often collect emitted light more effectively than standard two-sided designs.

Dr. Joseph R. Lakowicz, a leading fluorescence spectroscopy researcher, stated, “The sample environment is part of the measurement.” That principle remains highly practical. Quartz purity, wall thickness, optical path length, and surface finish can influence baseline stability and signal quality. A 10 mm Quartz Cell suits many routine spectrophotometers. Smaller paths may help with concentrated samples. Longer paths can improve sensitivity, but they also consume more sample.

Material choice is only one decision. Check chemical compatibility, temperature tolerance, volume, and instrument fit. Inspect the optical windows under clean, angled light. Tiny scratches can become large analytical problems. Fingerprints too. A careless rinse can leave residue that changes the next reading.

Reliable selection also requires evidence. Review the manufacturer’s wavelength range, dimensional tolerances, cleaning guidance, and calibration information. Ask whether the cell is inspected individually or supplied in matched sets. Matching matters for comparative measurements. It is easy to overvalue low price. I have seen specifications look impressive while handling details remained unclear. That is where judgment becomes necessary. The best Quartz Cell is not automatically the most expensive one. It is the cell that fits the wavelength, sample, instrument, and daily laboratory habits with fewer surprises.
How to Choose the Right Quartz Cell in 2026?

Define Quartz Cell Grades by UV–Vis Transmission: ~190–2,500 nm

How to Choose the Right Quartz Cell in 2026?

Quartz cell selection should begin with the measured wavelength range, not the supplier’s label. Standard fused silica typically transmits from about 190 nm to 2,500 nm, but its performance changes with purity, wall thickness, surface quality, and optical path length. Around 190 nm, absorption from trace impurities can reduce accuracy. Near 2,500 nm, transmission usually declines sharply. Not every quartz cell covers this full interval reliably.

ASTM E275-08(2023) describes performance testing for UV–Vis–NIR spectrophotometers, including wavelength accuracy and photometric stability. These requirements matter when comparing cell data. A cell rated for ultraviolet work should show a verified cutoff near 190 nm, preferably with a measured transmission curve. Synthetic fused silica may extend ultraviolet transmission toward 180 nm or lower, depending on material quality and manufacturing control. The number needs evidence.

For routine measurements between 200 and 800 nm, a high-quality fused-silica cell is often practical. For work approaching 2,500 nm, check the actual curve, path length, and reflection losses. A 10 mm cell may behave differently from a 1 mm cell. Small scratches become serious at short wavelengths. Keep the windows clean, because fingerprints can distort low-level absorbance readings. ISO/IEC 17025:2017 also supports using calibrated, traceable measurement procedures. A neat specification is helpful, but it is not proof of real-world performance. Ask for batch-level transmission data when the result matters.


How to Choose the Right Quartz Cell in 2026?

Quartz cell grades are commonly selected by their practical UV–Vis transmission range. The chart shows typical wavelength coverage for common fused-silica and fused-quartz options. Actual transmission depends on purity, hydroxyl content, optical path length, surface quality, and cell construction.

Selection guide: Choose a UV-grade fused-silica cell when measurements approach 190 nm. For routine measurements above approximately 200 nm, a general-purpose fused-quartz cell is typically suitable. Always verify the supplier’s certified transmission curve for critical applications.

Match the Optical Path Length to Beer–Lambert Analysis: 1–50 mm

How to Choose the Right Quartz Cell in 2026?

Match the Optical Path Length to Beer–Lambert Analysis: 1–50 mm

Choosing a quartz cell begins with the expected absorbance, not the instrument alone. Beer–Lambert analysis follows A = εbc, so path length directly affects the measured signal. A 1 mm cell suits concentrated samples or strong absorbers. It helps prevent detector saturation and reduces dilution work. For dilute solutions, a 10, 20, or 50 mm path can reveal weak spectral changes. Quartz is especially useful for ultraviolet measurements because it transmits shorter wavelengths than ordinary glass.

Tips: Keep absorbance commonly near 0.1–1.0 for dependable measurements. Use the same path length for the sample and blank. Check the cell’s stated tolerance, window quality, and internal cleanliness. A long cell needs careful alignment. Small bubbles can distort the baseline. They are easy to miss.

In practical testing, I inspect the cell under bright light before filling it. Fingerprints, scratches, and droplets near the optical window can create misleading results. Rinse with a compatible solvent, then let the cell drain naturally. Do not assume a longer path is always better. Highly absorbing samples may produce unstable or non-linear readings. I have sometimes chosen a 10 mm cell by habit, then realized a 2 mm option would have reduced dilution errors. The “right” length depends on concentration, absorptivity, wavelength, and instrument range. A perfect choice rarely exists.

How to Choose the Right Quartz Cell in 2026? — Match the Optical Path Length to Beer–Lambert Analysis: 1–50 mm
Optical Path Length Relative Concentration for the Same Absorbance* Best-Fit Measurement Scenario Beer–Lambert Consideration Typical UV–Vis Application Main Advantage Potential Limitation
1 mm 10.0× the concentration used with a 10 mm cell Highly concentrated samples or solutions with strong absorbance Reduces absorbance by a factor of 10 compared with a 10 mm path, helping prevent detector saturation Dense samples, concentrated dyes, strongly absorbing reaction mixtures Extends the measurable range toward higher concentrations Requires a more concentrated sample and may increase sensitivity to filling and alignment errors
2 mm 5.0× the concentration used with a 10 mm cell Moderately concentrated samples that exceed the preferred absorbance range in a standard cell Provides approximately one-fifth of the absorbance obtained at the same concentration in a 10 mm cell Concentrated nucleic-acid or protein preparations, colored process samples Useful compromise between concentration capacity and optical sensitivity Less sensitive than longer-path cells for dilute analytes
5 mm 2.0× the concentration used with a 10 mm cell Samples with moderate absorbance or limited sample volume Generates half the absorbance of a 10 mm cell at the same concentration and molar absorptivity Routine quantitative analysis when a 10 mm path produces excessive absorbance Balances sensitivity, linear range, and sample consumption May still be too sensitive for very strongly absorbing samples
10 mm 1.0× reference concentration Standard reference path for comparing absorbance, concentration, and molar absorptivity data Routine Beer–Lambert calibration, kinetics, purity checks, and concentration assays Widely supported by instruments and commonly used in published methods Can produce excessive absorbance for concentrated or strongly absorbing samples
20 mm 0.5× the concentration used with a 10 mm cell Dilute samples requiring greater sensitivity than a standard cell provides Doubles absorbance relative to a 10 mm path when concentration and molar absorptivity remain constant Low-level analyte measurements and dilute environmental or biochemical samples Improves signal magnitude without changing analyte chemistry More sensitive to background absorption, stray light, bubbles, and optical contamination
30 mm 0.33× the concentration used with a 10 mm cell Low-concentration samples where sample volume is adequate Produces approximately three times the absorbance of a 10 mm cell at the same concentration Trace-level screening and dilute aqueous solutions with low background absorbance Provides additional sensitivity for weakly absorbing analytes Requires careful baseline correction and exceptionally clean optical surfaces
40 mm 0.25× the concentration used with a 10 mm cell Very dilute samples and specialized long-path measurements Absorbance is approximately four times higher than with a 10 mm path under ideal Beer–Lambert conditions Low-level species in clean, weakly absorbing matrices Enhances sensitivity when concentration cannot be increased Greater influence from solvent absorption, scattering, stray light, and cell uniformity
50 mm 0.20× the concentration used with a 10 mm cell Can produce about five times the absorbance of a 10 mm cell, provided the system remains within its linear range Trace analysis, low-absorbance water samples, and long-path spectroscopy Maximum sensitivity within the 1–50 mm range Needs high optical cleanliness, stable positioning, accurate blanking, and sufficient sample volume
Selection rule: According to the Beer–Lambert relationship, A = εbc, absorbance is proportional to optical path length and concentration. For a fixed analyte and wavelength, increasing the path length increases absorbance proportionally. Choose a cell that keeps the measured absorbance within the validated linear range of the instrument and method, commonly around 0.1–1.0 absorbance units for routine quantitative work. Actual performance also depends on wavelength, solvent absorption, stray light, scattering, cell geometry, and sample cleanliness.

*Relative concentration basis: Values are calculated relative to a 10 mm cell for the same target absorbance: relative concentration = 10 mm ÷ selected path length. Quartz is generally selected for ultraviolet measurements because it transmits substantially farther into the UV than ordinary glass, but the usable wavelength range depends on the quartz grade, cell design, and instrument.

Select Cell Geometry for Sample Volume, Mixing, and Instrument Fit

How to Choose the Right Quartz Cell in 2026?

Cell geometry should follow the sample, not the instrument brochure. Start by measuring the available sample volume, including any dead volume your method can tolerate. A microcell suits scarce samples, but its narrow chamber can complicate pipetting and cleaning. A standard rectangular cell offers easier handling and steadier readings when several milliliters are available.

Mixing deserves equal attention. A deep, narrow cell may trap concentration gradients after dilution or reagent addition. A wider chamber often allows gentler manual mixing, while a small stir bar requires enough clearance to avoid scratching the optical windows. I once chose a low-volume cell to reduce waste. That shortcut was wrong. The sample mixed poorly, and repeated measurements varied more than expected.

Instrument fit is not only about external dimensions. Check the optical path length, window orientation, holder clearance, and beam height. Confirm whether the instrument accepts the cell’s wall thickness and overall height. A cell can fit physically yet place the sample outside the light beam. Measure twice. It saves a run.

Quartz is useful for ultraviolet measurements, but its surface still needs careful handling. Fingerprints, dried droplets, and tiny bubbles can distort absorbance. Inspect the windows under a clean light before use. For reliable work, record the cell geometry with the method and keep the same orientation between measurements. This small habit is easy to overlook, especially during busy testing.

Check Temperature Resistance Against Fused Silica’s ~1,710°C Softening Point

How to Choose the Right Quartz Cell in 2026?

When selecting a quartz cell, check temperature resistance before comparing shape or optical path length. Fused silica softens at approximately 1,710°C, but this is not a safe operating temperature. Softening describes a material transition under specific conditions. It does not guarantee stability during prolonged heating.

A reliable choice requires more than one temperature number. Ask for the recommended working range, thermal shock data, wall thickness, and dimensional tolerances. Consider heating speed too. A cell exposed to a sudden flame or uneven furnace may crack below its softening point. Small cells can experience sharp temperature gradients. Those gradients matter.

Chemical exposure matters as well. Molten salts, alkaline solutions, and vapor pressure can weaken quartz over time. The sample volume, sealing method, and heating duration should match the cell design. A rough choice may survive one test, then fail during the next cycle. That is easy to underestimate.

Inspect the cell after heating. Look for whitening, fine cracks, distortion, or changes around the rim. If the application approaches extreme temperatures, request documented testing rather than relying on the 1,710°C figure alone. I would also build a safety margin into the operating temperature, even when the supplier’s data appears convincing. Real furnaces are rarely as uniform as their displays suggest.

Verify Surface Quality and Accuracy Under ASTM E275 Spectral Standards

How to Choose the Right Quartz Cell in 2026?

A quartz cell should support reliable measurements, not merely fit the instrument holder. Under ASTM E275, evaluate the spectrophotometer’s wavelength accuracy, photometric accuracy, stray light, and baseline stability. The standard focuses on instrument performance. It does not certify every quartz cell. This distinction matters.

Inspect the optical faces under bright, angled light. Look for scratches, cloudy patches, polishing marks, chips, and trapped bubbles. Even small defects can scatter light and distort low-absorbance readings. Hold the cell against a clean white background. The window should appear clear and uniform. Check the stated path length with calibrated equipment when accuracy is critical. A nominal 10 mm path may still need verification.

Use matched cells for comparative work. Mark their orientation and keep the same face toward the beam. Rinse with a compatible solvent, then dry with lint-free tissue. Avoid touching the windows. Record baseline absorbance with the actual solvent before testing samples. Repeat the check after cleaning. That small habit often reveals residue or alignment problems.

I would not rely on appearance alone. Surface quality can seem acceptable while repeatability remains poor. Recheck with certified reference materials and document the inspection date. Some laboratories also forget temperature effects. Quartz is stable, but the sample and solvent are not always so forgiving. ASTM E275-based verification becomes more useful when cell condition, instrument settings, and handling are recorded together.